As a screening body, the Commission's role is to help parties resolve their matters in the quickest, most confidential, and fair way as possible. This can involve mediation, referral to another organization, or referral to the Canadian Human Rights Tribunal.
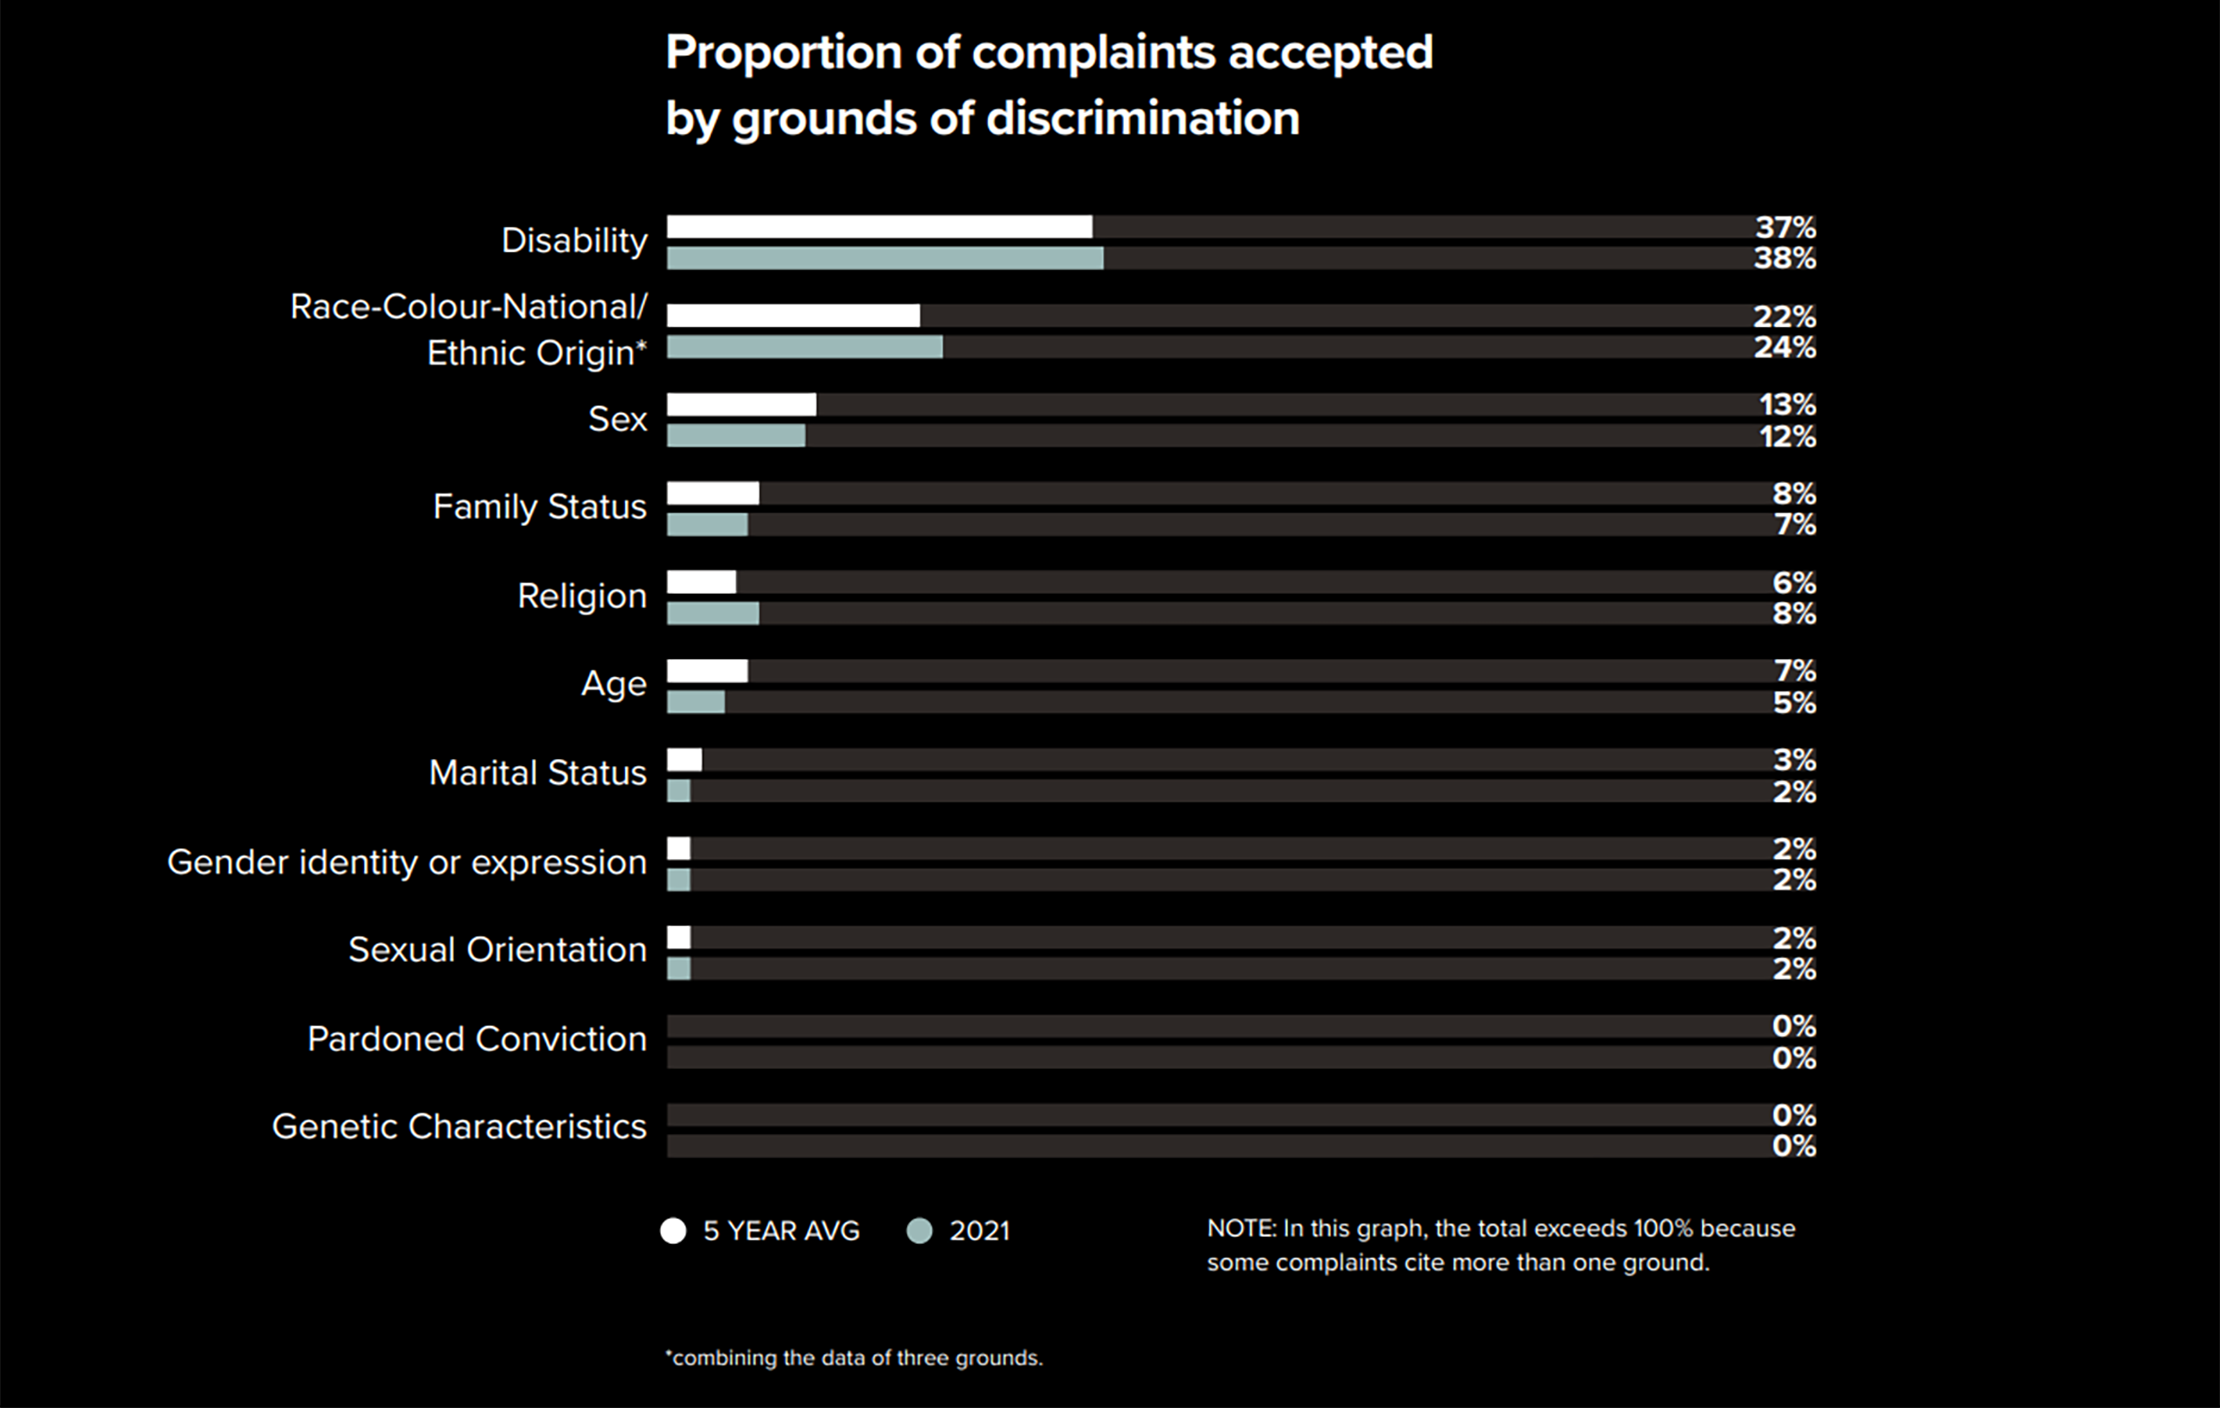
Proportion of complaints accepted by grounds of discrimination
Legend Proportion of complaints accepted by groups of discrimination - Text version
| Grounds of discrimination | Pourcentage of complaints accepted | |
|---|---|---|
| 5 year average | 2021 | |
| Disability | 37% | 38% |
| Race-Colour-National and Ethnic Origintable note * | 22% | 24% |
| Sex | 13% | 12% |
| Family Status | 8% | 7% |
| Religion | 6% | 8% |
| Age | 7% | 5% |
| Marital Status | 3% | 2% |
| Gender Identity or expression | 2% | 2% |
| Sexual Orientation | 2% | 2% |
| Pardoned Conviction | 0% | 0% |
| Genetic Characteristics | 0% | 0% |
|
||
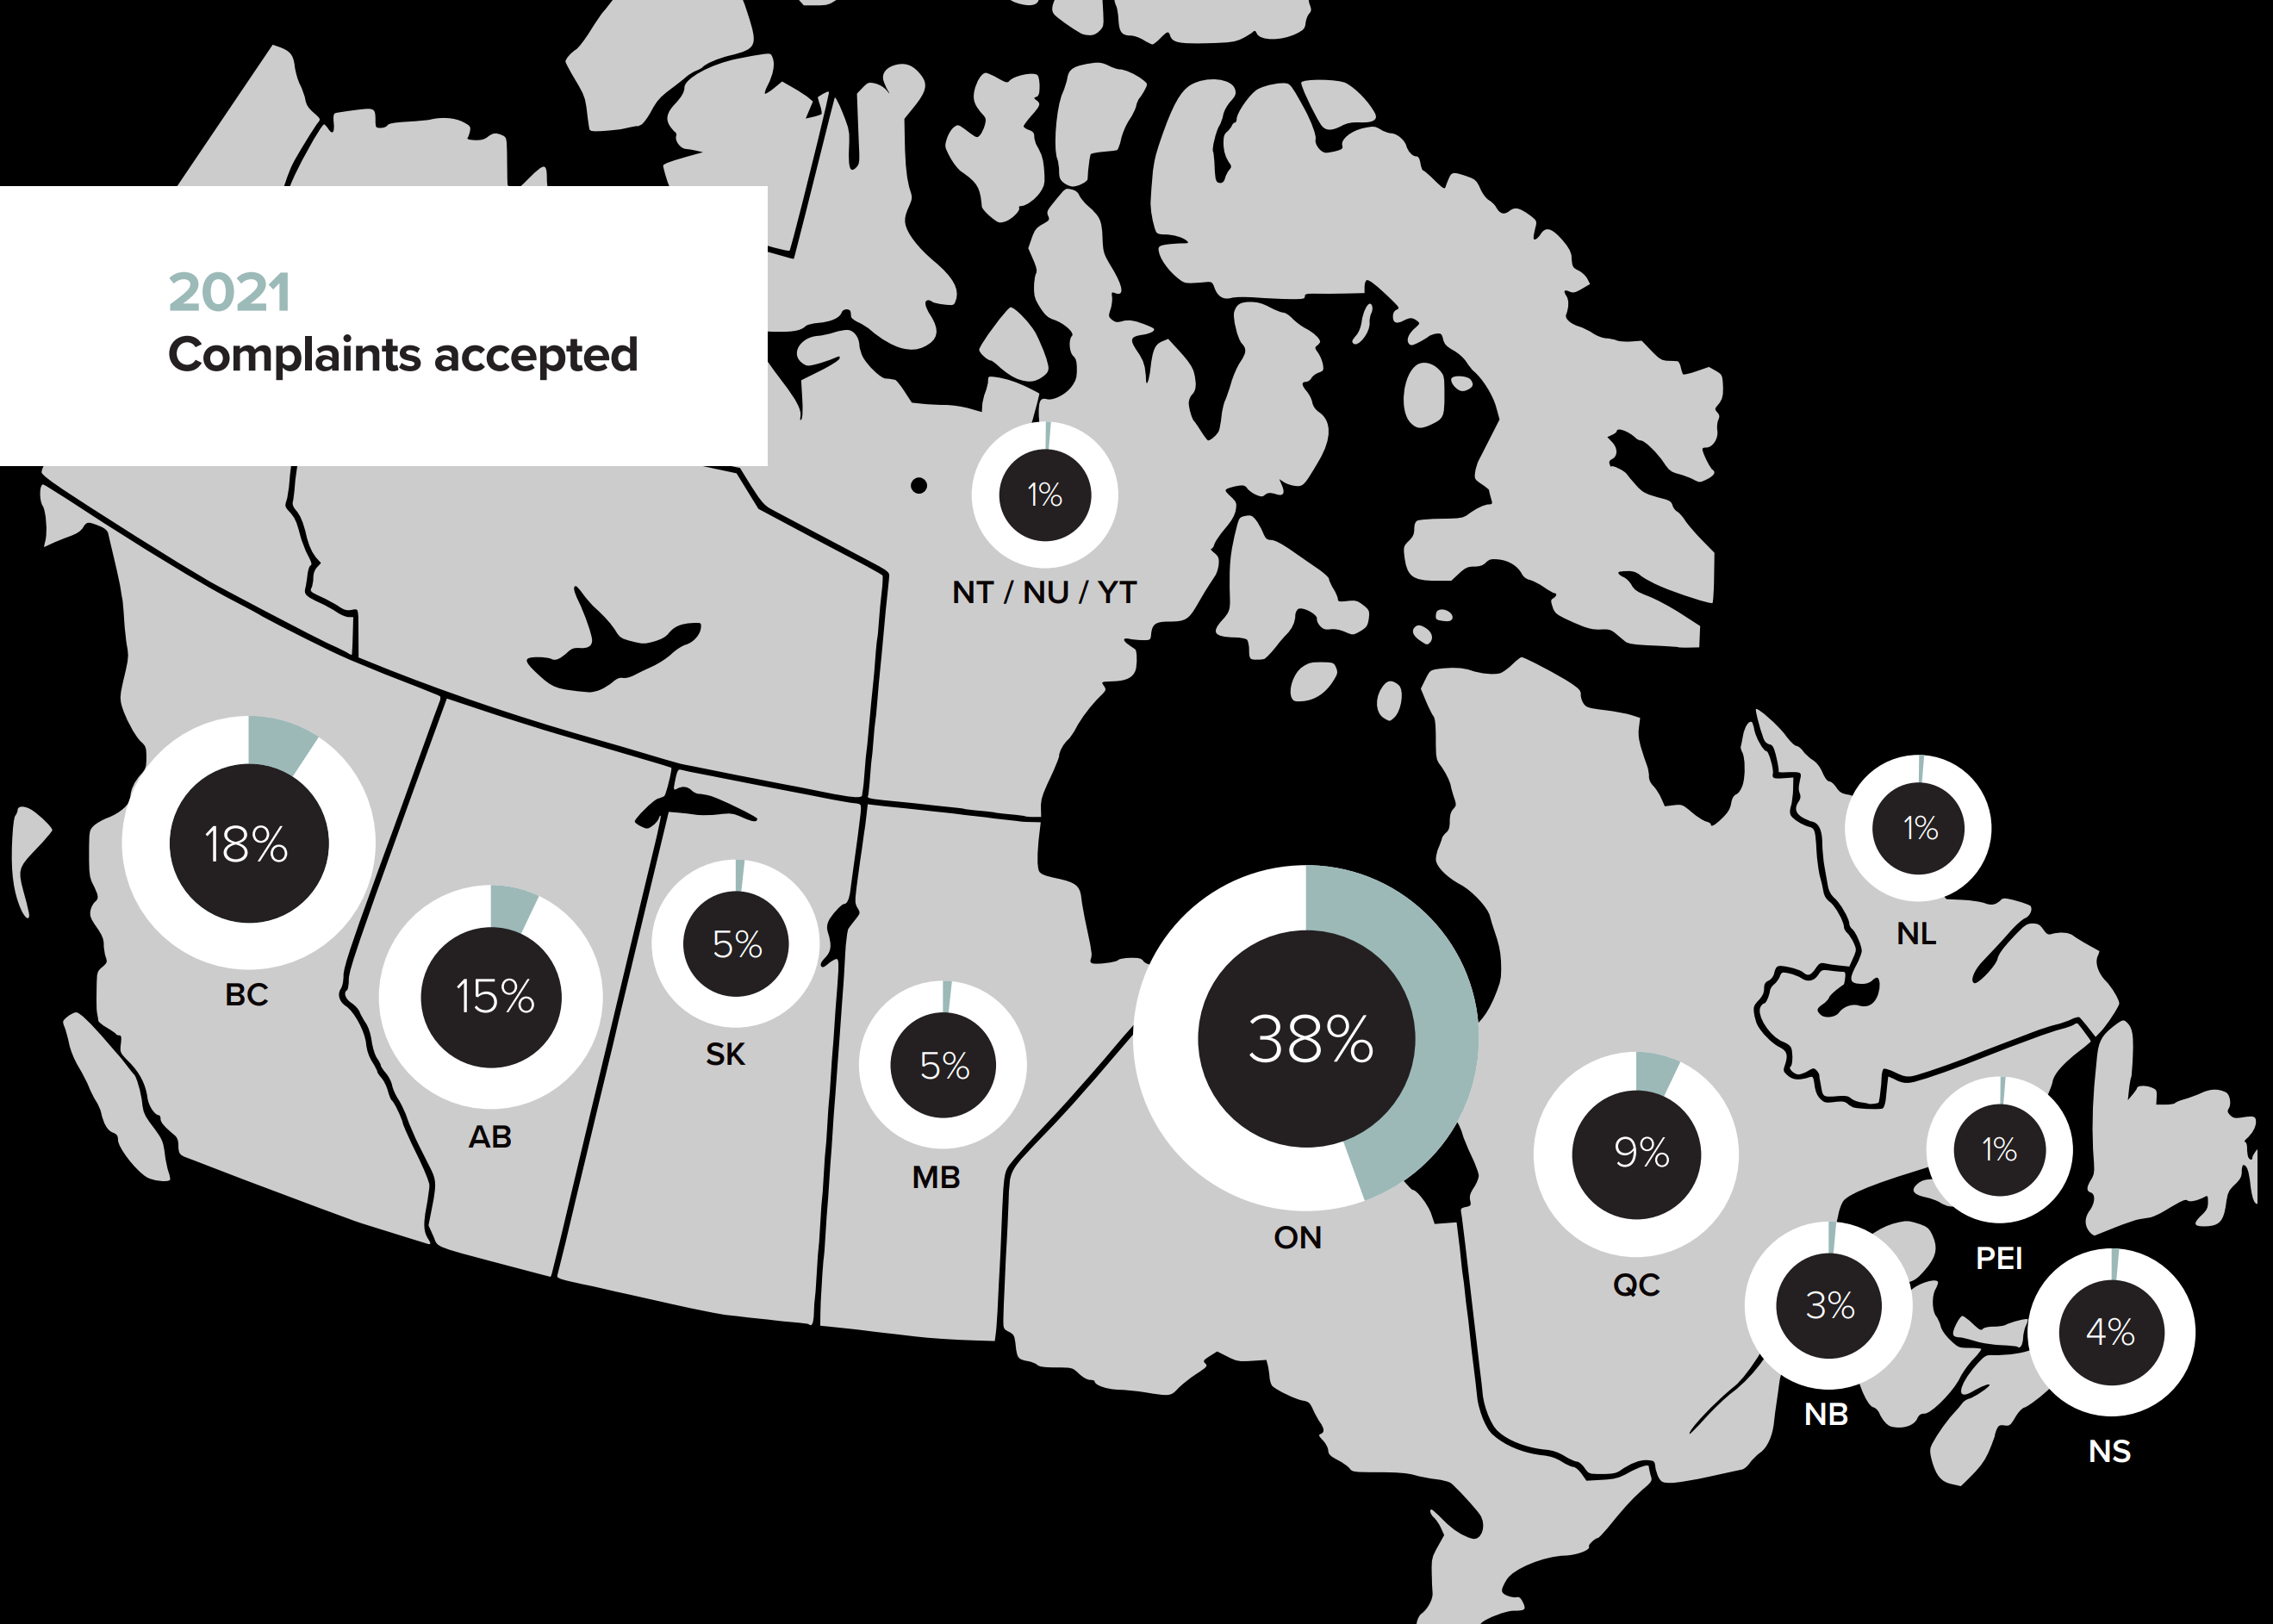
2021 Complaints accepted
Legend 2021 Complaints accepted - Text version
The map of Canada shows the percentage of accepted complaints for each province and territory.
| Canadian provinces and territories | Pourcentage of complaints accepted |
|---|---|
| Nova Scotia | 4% |
| Prince Edward Island | 1% |
| New Brunswick | 3% |
| Newfoundland and Labrador | 1% |
| Quebec | 9% |
| Ontario | 38% |
| Manitoba | 5% |
| Saskatchewan | 5% |
| Alberta | 15% |
| British-Columbia | 18% |
| Northwest Territories, Nunavut, Yukon | 1% |
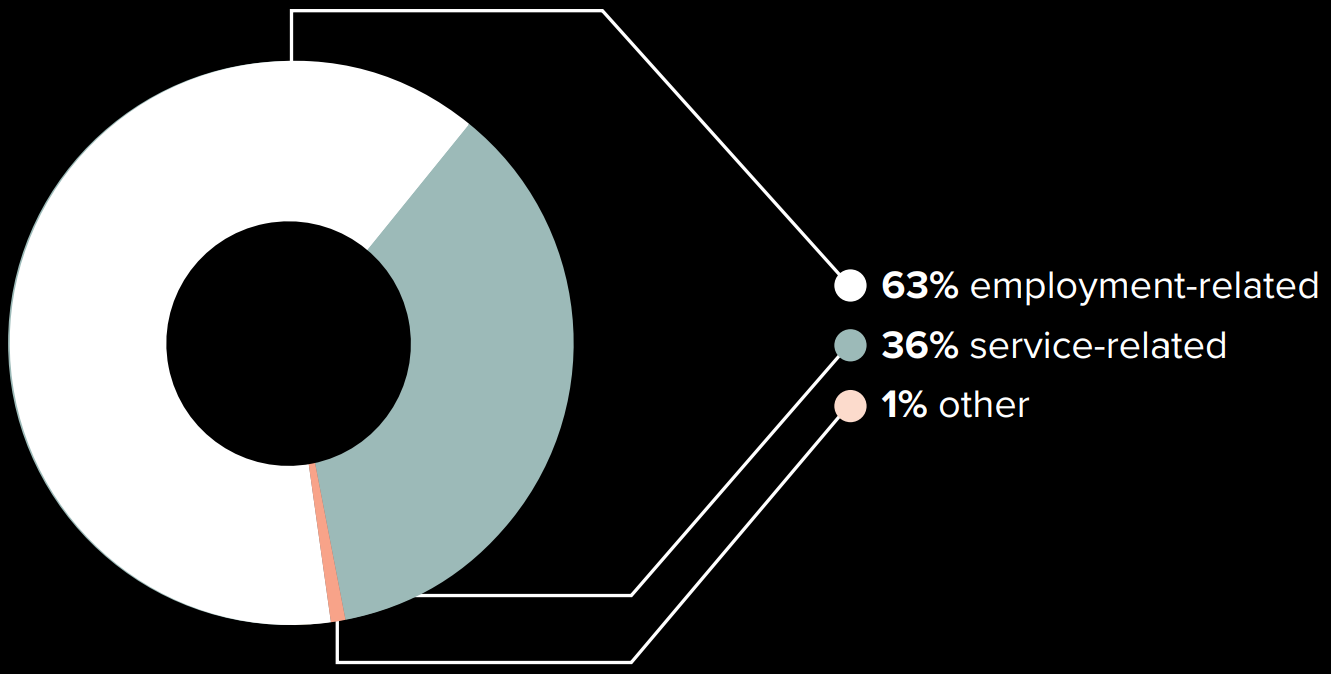
What are the 2021 complaints about?
Legend What are the 2021 complaints about - Text version
The pie chart represents:
- 63% Employment-related
- 36% Service-related
- 1% Other
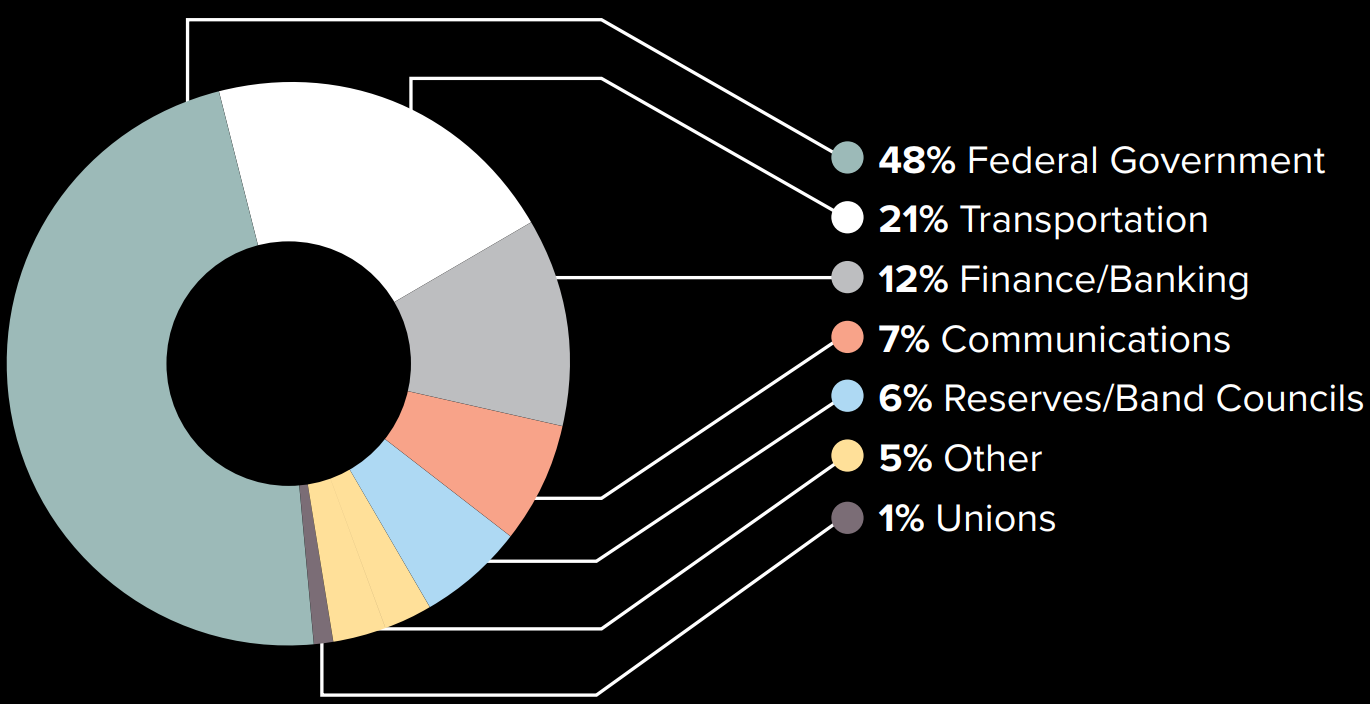
Who are the 2021 complaints about?
Legend Who are the 2021 complaints about - Text version
The pie chart represents:
- 48% Federal Government
- 21% Transportation
- 12% Finance/Banking
- 7% Communications
- 6% Reserves/Band Councils
- 5% Other
- 1% Unions
Final Decisions 2021
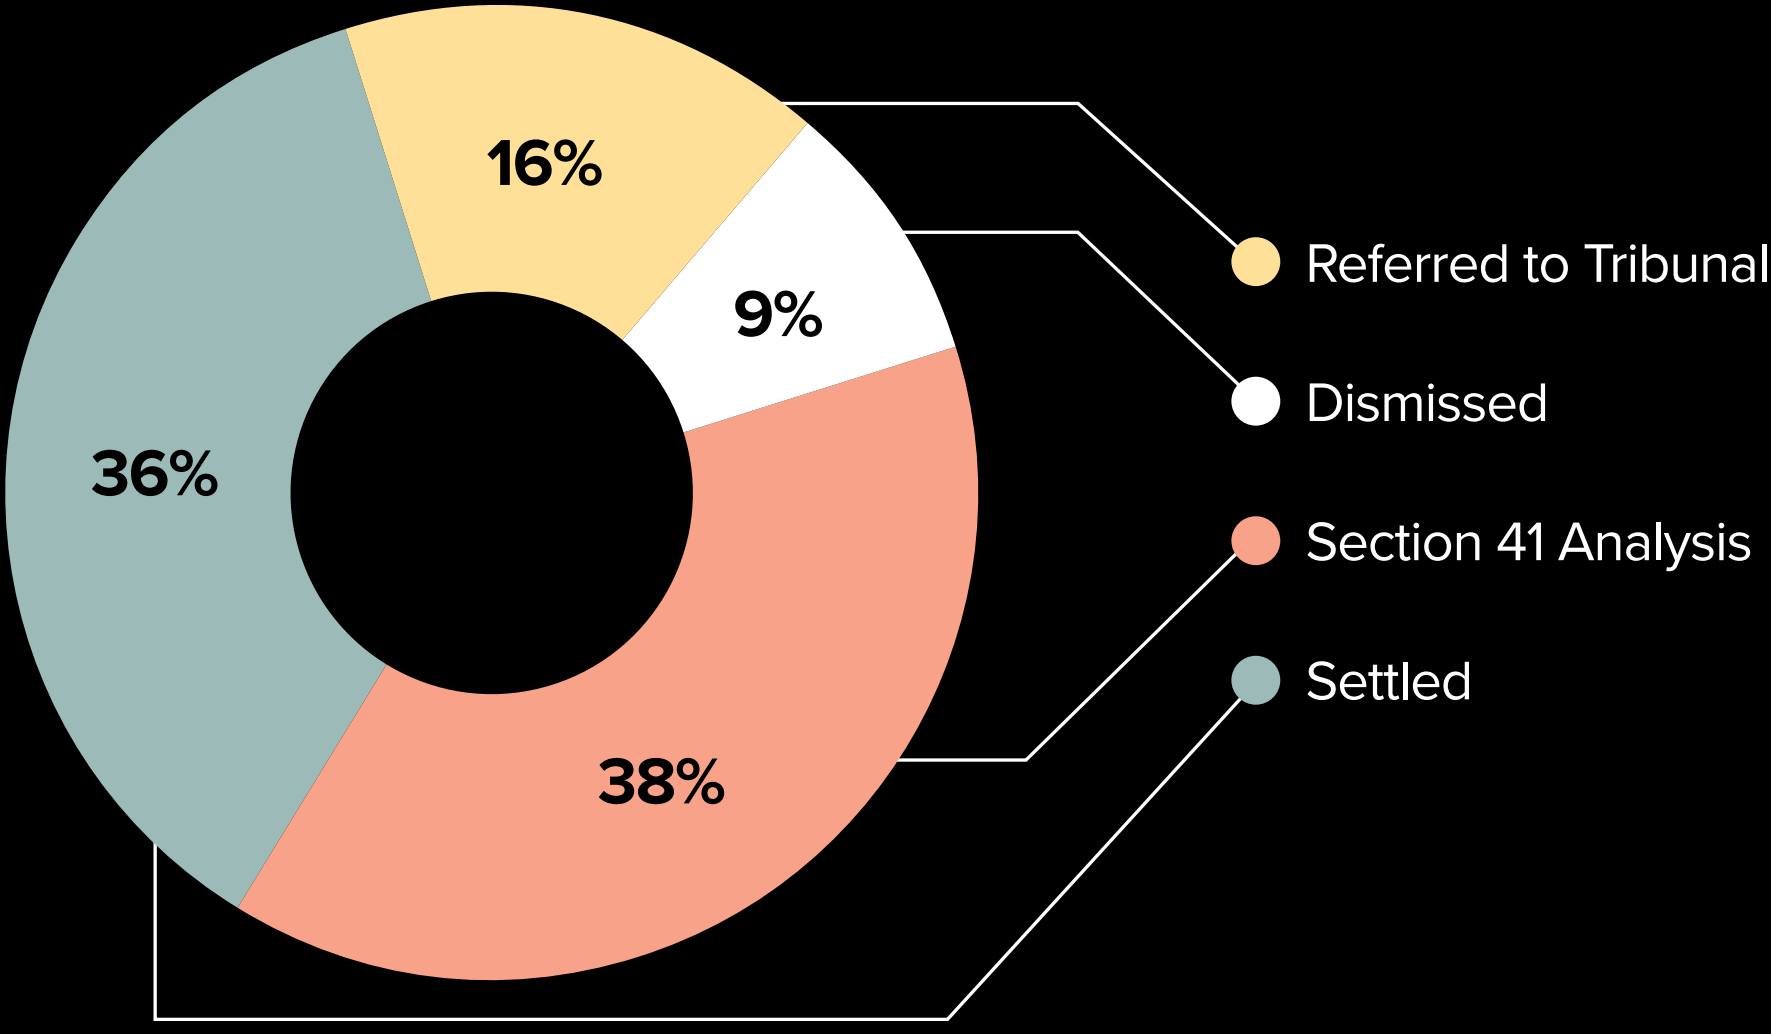
Legend Final decisions 2021 - Text version
The image shows a pie chart representing:
- 38% Section 41 Analysis
- 36% Settled
- 16% Referred to Tribunal
- 9% Dismissed
Final Decisions by Ground
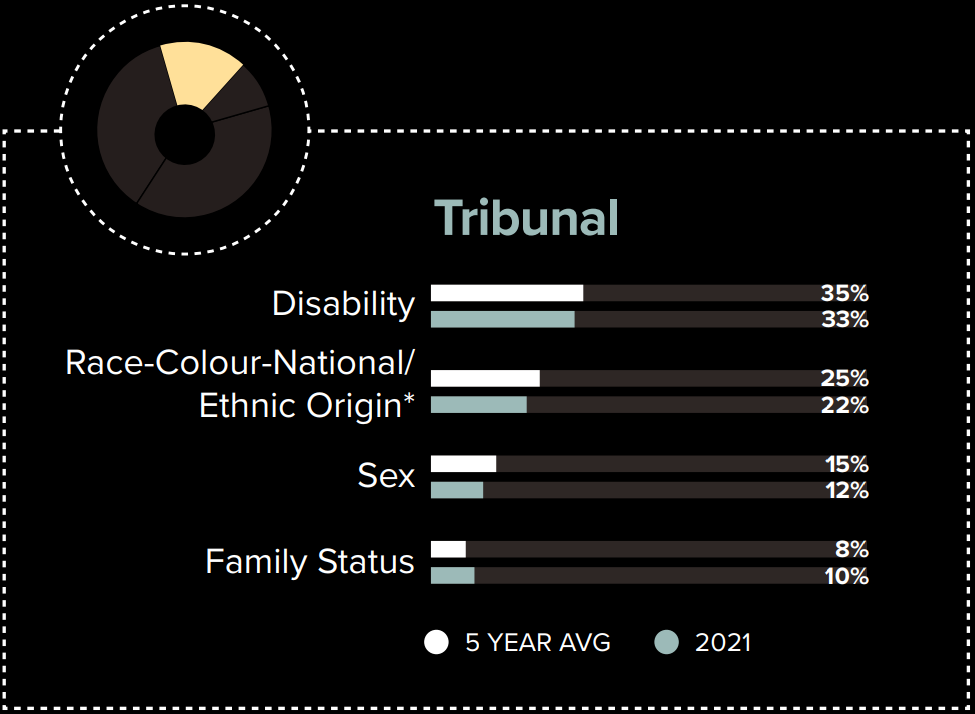
Legend Ground: Tribunal - Text version
The 16% pie chart section includes:
| 5 year average | 2021 | |
|---|---|---|
| Disability | 35% | 33% |
| Race-Colour-National/Ethnic Origintable note * | 25% | 22% |
| Sex | 15% | 12% |
| Family Status | 8% | 10% |
| Table note * combining the data of three grounds. Return to table note * referrer | ||
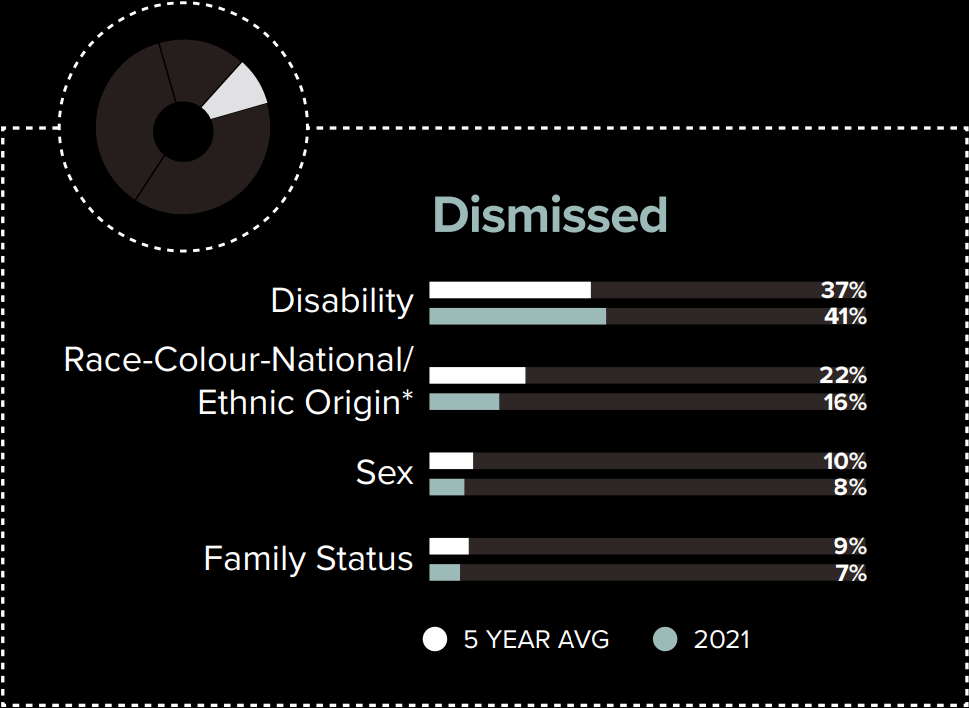
Legend Ground: Dismissed - Text version
The 9% pie chart section includes:
| 5 year average | 2021 | |
|---|---|---|
| Disability | 37% | 41% |
| Race-Colour-National/Ethnic Origintable note * | 22% | 16% |
| Sex | 10% | 8% |
| Family Status | 9% | 7% |
| Table note * combining the data of three grounds. Return to table note * referrer | ||
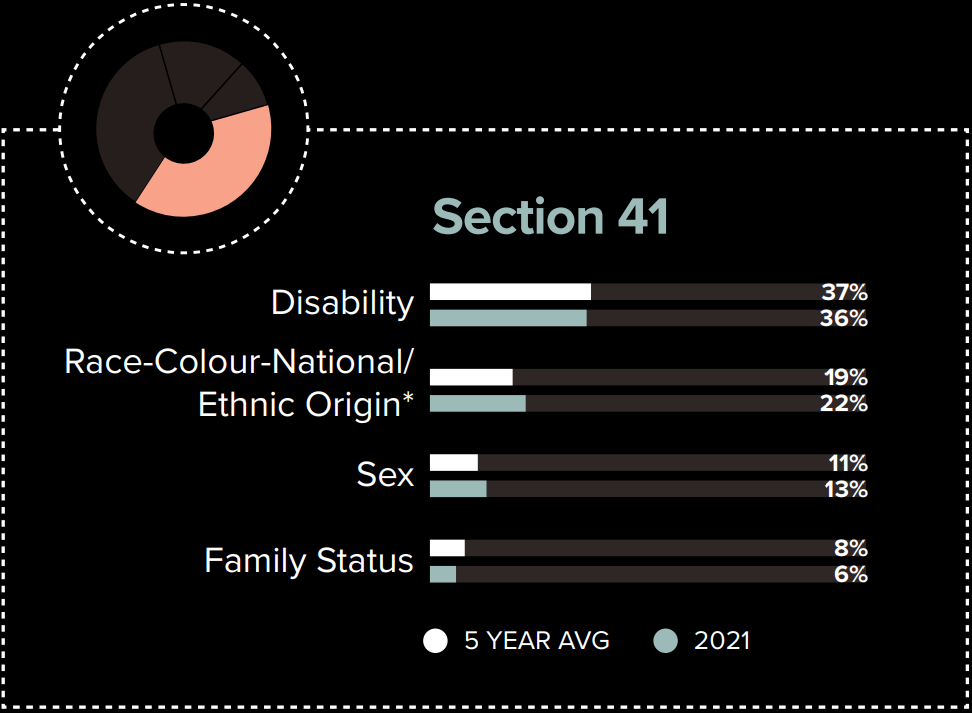
Legend Ground: Section 41 - Text version
The 38% pie chart section includes:
| 5 year average | 2021 | |
|---|---|---|
| Disability | 37% | 36% |
| Race-Colour-National/Ethnic Origintable note * | 19% | 22% |
| Sex | 11% | 13% |
| Family Status | 8% | 6% |
| Table note * combining the data of three grounds. Return to table note * referrer | ||
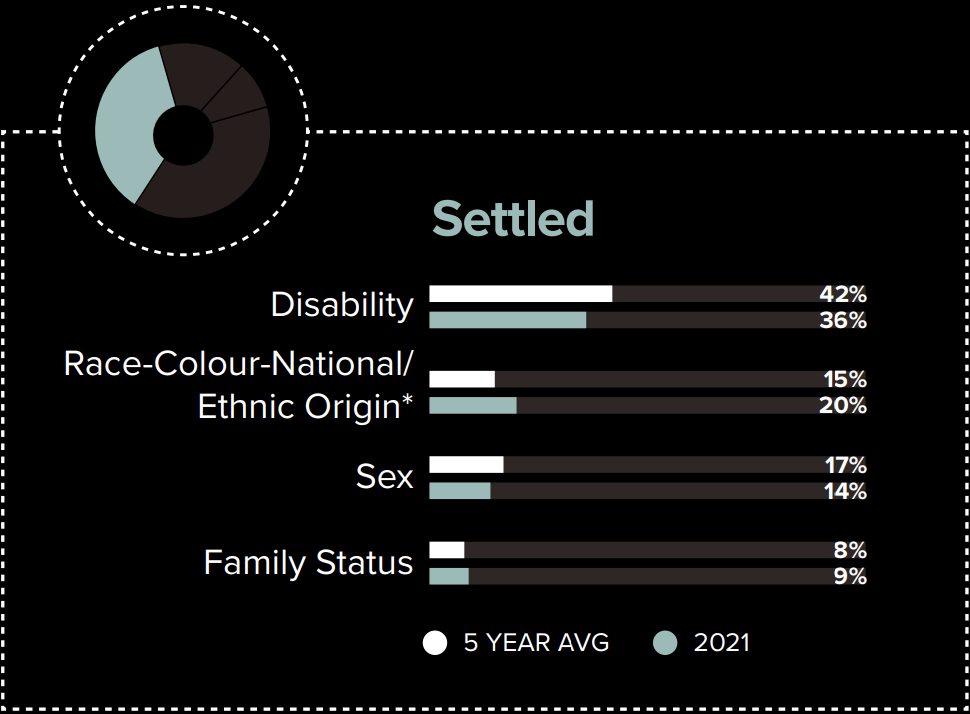
Legend Ground: Settled - Text version
The 36% pie chart section includes:
| 5 year average | 2021 | |
|---|---|---|
| Disability | 42% | 36% |
| Race-Colour-National/Ethnic Origintable note * | 15% | 20% |
| Sex | 17% | 14% |
| Family Status | 8% | 9% |
| Table note * combining the data of three grounds. Return to table note * referrer | ||